MATIC Price (Polygon) Sets Sights Higher: Can It Gain Bullish Momentum?
MATIC price is showing positive signs from the $0.3920 zone. Polygon is rising and might gain bullish momentum above the $0.4220 resistance. MATIC price started a fresh increase above the $0.410 level against the US dollar. The price is trading above $0.4120 and the 100-hour simple moving average. There is a key rising channel forming with support at $0.4125 on the hourly chart of the MATIC/USD pair (data source from Kraken). The pair could gain bullish momentum if it clears the $0.4220 and $0.4250 resistance levels. Polygon Price Aims Higher After forming a base above the $0.3920 level, Polygon’s price started a fresh increase above the $0.400 pivot level. MATIC is moving higher above the $0.4100 level and beating Ethereum and Bitcoin. There was a move above the $0.4120 level. The price climbed above the 50% Fib retracement level of the downward move from the $0.4317 swing high to the $0.3922 low. There is also a key rising channel forming with support at $0.4125 on the hourly chart of the MATIC/USD pair. MATIC is trading above $0.4150 and the 100 simple moving average (4 hours). Immediate resistance is near the $0.4220 zone. It is close to the 76.4% Fib retracement level of the downward move from the $0.4317 swing high to the $0.3922 low. The first major resistance is near the $0.4250 level. If there is an upside break above the $0.4250 resistance level, the price could continue to rise. The next major resistance is near $0.4450. A clear move above the $0.4450 resistance could start a steady increase. In the stated case, the price could even attempt a move toward the $0.4620 level or $0.480. Another Dip in MATIC? If MATIC’s price fails to rise above the $0.4220 resistance level, it could start another decline. Immediate support on the downside is near the $0.4150 level. The main support is near the $0.4120 level and the channel trend line. A downside break below the $0.4120 level could open the doors for a fresh decline toward $0.40. The next major support is near the $0.3920 level. Technical Indicators Hourly MACD – The MACD for MATIC/USD is gaining momentum in the bullish zone. Hourly RSI (Relative Strength Index) – The RSI for MATIC/USD is now above the 50 level. Major Support Levels – $0.4150 and $0.4120. Major Resistance Levels – $0.4220, $0.4250, and $0.4450.

MATIC price is showing positive signs from the $0.3920 zone. Polygon is rising and might gain bullish momentum above the $0.4220 resistance.
- MATIC price started a fresh increase above the $0.410 level against the US dollar.
- The price is trading above $0.4120 and the 100-hour simple moving average.
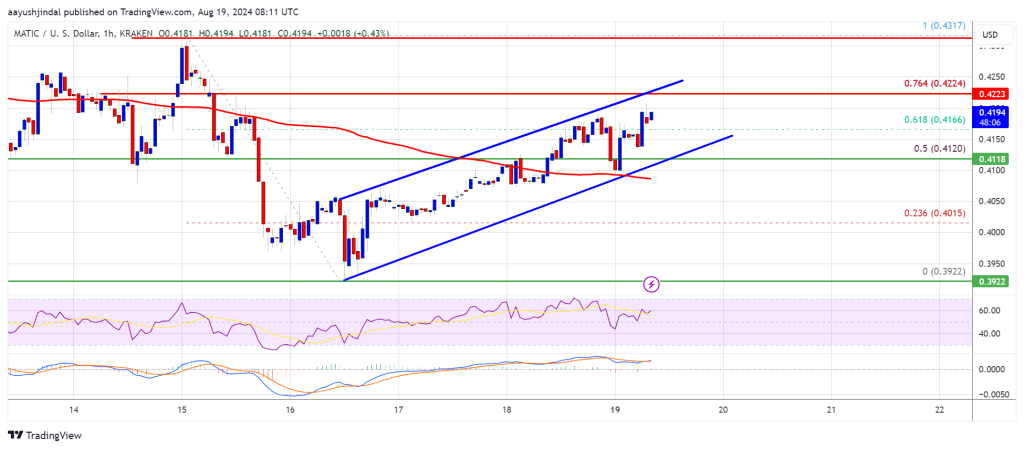
- There is a key rising channel forming with support at $0.4125 on the hourly chart of the MATIC/USD pair (data source from Kraken).
- The pair could gain bullish momentum if it clears the $0.4220 and $0.4250 resistance levels.
Polygon Price Aims Higher
After forming a base above the $0.3920 level, Polygon’s price started a fresh increase above the $0.400 pivot level. MATIC is moving higher above the $0.4100 level and beating Ethereum and Bitcoin.
There was a move above the $0.4120 level. The price climbed above the 50% Fib retracement level of the downward move from the $0.4317 swing high to the $0.3922 low. There is also a key rising channel forming with support at $0.4125 on the hourly chart of the MATIC/USD pair.
MATIC is trading above $0.4150 and the 100 simple moving average (4 hours). Immediate resistance is near the $0.4220 zone. It is close to the 76.4% Fib retracement level of the downward move from the $0.4317 swing high to the $0.3922 low.
The first major resistance is near the $0.4250 level. If there is an upside break above the $0.4250 resistance level, the price could continue to rise. The next major resistance is near $0.4450. A clear move above the $0.4450 resistance could start a steady increase. In the stated case, the price could even attempt a move toward the $0.4620 level or $0.480.
Another Dip in MATIC?
If MATIC’s price fails to rise above the $0.4220 resistance level, it could start another decline. Immediate support on the downside is near the $0.4150 level.
The main support is near the $0.4120 level and the channel trend line. A downside break below the $0.4120 level could open the doors for a fresh decline toward $0.40. The next major support is near the $0.3920 level.
Technical Indicators
Hourly MACD – The MACD for MATIC/USD is gaining momentum in the bullish zone.
Hourly RSI (Relative Strength Index) – The RSI for MATIC/USD is now above the 50 level.
Major Support Levels – $0.4150 and $0.4120.
Major Resistance Levels – $0.4220, $0.4250, and $0.4450.
What's Your Reaction?