Solana Eases Gains: Can SOL Bulls Safeguard the $132 Support?
Solana started a fresh decline from the $155 resistance. SOL price is down over 10%, but the bulls are now protecting the $132 support. SOL price started a strong decline from the $155 resistance against the US Dollar. The price is now trading below $145 and the 100-hourly simple moving average. There was a break below a connecting bullish trend line with support at $150 on the hourly chart of the SOL/USD pair (data source from Kraken). The pair could correct losses unless the bulls struggle to protect the $132 support. Solana Price Dives 10% Solana price struggled to continue higher above the $155 resistance. SOL reacted to the downside and declined below the $150 support. There was a break below a connecting bullish trend line with support at $150 on the hourly chart of the SOL/USD pair. The pair gained bearish momentum below the $145 support and declined more than outperformed Bitcoin and Ethereum in the past two sessions. There was a drop toward the $132 support zone. A low was formed at $132.17 and the price is now attempting a recovery wave. There was a move above the $135 level. The price is now approaching the 23.6% Fib retracement level of the recent decline from the $154.74 swing high to the $132.17 low. Solana is now trading well below the $145 level and the 100-hourly simple moving average. If there is another increase, the price might face resistance near the $138 level. The next major resistance is near the $143.50 level and the 50% Fib retracement level of the recent decline from the $154.74 swing high to the $132.17 low. A successful close above the $143.50 resistance could set the pace for another steady increase. The next key resistance is near $150. Any more gains might send the price toward the $155 level. More Losses in SOL? If SOL fails to rise above the $143.50 resistance, it could start another decline. Initial support on the downside is near the $135 level. The first major support is near the $132 level, below which the price could test $125. If there is a close below the $125 support, the price could decline toward the $112 support in the near term. Technical Indicators Hourly MACD – The MACD for SOL/USD is gaining pace in the bearish zone. Hourly Hours RSI (Relative Strength Index) – The RSI for SOL/USD is below the 50 level. Major Support Levels – $135, and $132. Major Resistance Levels – $143.50 and $150.
Solana started a fresh decline from the $155 resistance. SOL price is down over 10%, but the bulls are now protecting the $132 support.
- SOL price started a strong decline from the $155 resistance against the US Dollar.
- The price is now trading below $145 and the 100-hourly simple moving average.
- There was a break below a connecting bullish trend line with support at $150 on the hourly chart of the SOL/USD pair (data source from Kraken).
- The pair could correct losses unless the bulls struggle to protect the $132 support.
Solana Price Dives 10%
Solana price struggled to continue higher above the $155 resistance. SOL reacted to the downside and declined below the $150 support. There was a break below a connecting bullish trend line with support at $150 on the hourly chart of the SOL/USD pair.
The pair gained bearish momentum below the $145 support and declined more than outperformed Bitcoin and Ethereum in the past two sessions. There was a drop toward the $132 support zone. A low was formed at $132.17 and the price is now attempting a recovery wave.
There was a move above the $135 level. The price is now approaching the 23.6% Fib retracement level of the recent decline from the $154.74 swing high to the $132.17 low.
Solana is now trading well below the $145 level and the 100-hourly simple moving average. If there is another increase, the price might face resistance near the $138 level. The next major resistance is near the $143.50 level and the 50% Fib retracement level of the recent decline from the $154.74 swing high to the $132.17 low.
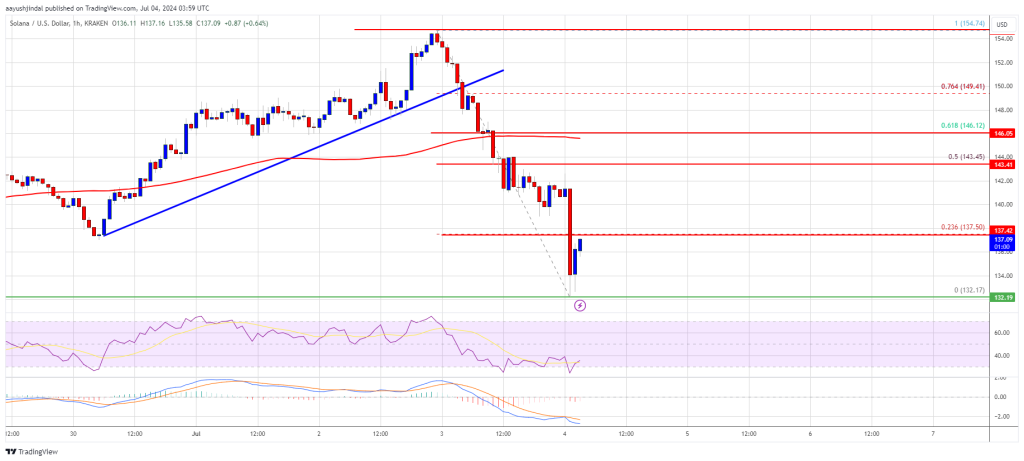
A successful close above the $143.50 resistance could set the pace for another steady increase. The next key resistance is near $150. Any more gains might send the price toward the $155 level.
More Losses in SOL?
If SOL fails to rise above the $143.50 resistance, it could start another decline. Initial support on the downside is near the $135 level.
The first major support is near the $132 level, below which the price could test $125. If there is a close below the $125 support, the price could decline toward the $112 support in the near term.
Technical Indicators
Hourly MACD – The MACD for SOL/USD is gaining pace in the bearish zone.
Hourly Hours RSI (Relative Strength Index) – The RSI for SOL/USD is below the 50 level.
Major Support Levels – $135, and $132.
Major Resistance Levels – $143.50 and $150.
What's Your Reaction?